Design phase. Prototype. Flowchart. ERD. DFD.
A prototype is a model of the intended (future) system.

The prototype does not work but will allow users to see the way in which the web-site/system will function. Prototype will show screen layouts, menus, forms etc.
Development of a prototype will allow the customer to get a complete picture of how the system will look in the final result. Prototyping simplifies the design process by focusing on important elements of the interface. Having a prototype, the designer and the customer have a clearer idea of the final result.
During prototype development, the designer can receive customer feedback for improvement. As a result, the client must obtain approval for the prototype to implement the future system.
Prototypes are a way for designers and developers to test flow, interaction, content, and the overall feasibility and usability of a product before creating and designing a fully functional product.
Advantages of using prototyping
To enable the user to participate in the design process.
Check if the design meets the user's needs.
To help the designer understand that design is what the user wants.
Errors can be detected much earlier.
Missing functionality can be identified easily
Disadvantages of using prototyping
Time-consuming and expensive, especially if you are on a tight budget.
Prototype design can constrain a designer's ideas.
If the designer's knowledge is limited, it may not be possible to assess the complexity of the implementation, leading to unlimited development time.
A framework is a platform for developing software applications. It provides a foundation on which software developers can build programs for a specific platform. A framework is a collection of useful tools written for a specific programming language. You can use these tools and link them with written programming code to create a new application.
Frameworks are developed to achieve the following goals:
Provide a consistent object-oriented programming environment
Provide a code execution environment that: Minimizes software deployment and version conflicts. Facilitates the secure execution of code. Eliminates performance issues.
Provide a single path of interaction with developers for a wide variety of application types, such as Windows apps and web apps.
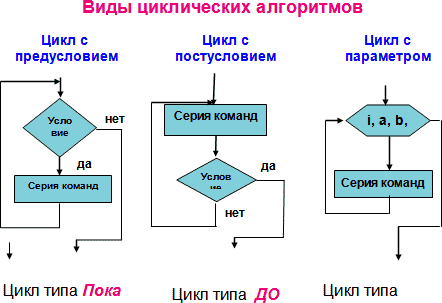
A flowchart is a visual representation of the sequence of steps and decisions needed to perform a process
Advantages
A great tool to see the sequence of an algorithm.
It clearly shows what decisions need to be made along with the inputs and outputs.
Just by looking at the flowchart, you can see how simple or complex the algorithm is.
Disadvantages
Drawing straight shapes can be time consuming. Although there are special applications only for flowcharts.
It is very inconvenient to change the flowchart after completion.
Not very useful for very complex and large algorithms.
Symbols of flowchart
| Symbol (Shape) | Name | Purpose |
 | Terminator | An oval represents start and stop point |
 | Input / Output | A parallelogram represents input data or output data |
 | Arrow | An arrow is a connector that shows the relationship between the representative shapes |
 | Process (Action) | A rectangle represents a process |
 | Decision | A diamond indicates a decision |
 | Loop | A hexagon shows the start of loop |
 | Subroutine | A predefined process symbol indicates the execution of another sub-algorithm |
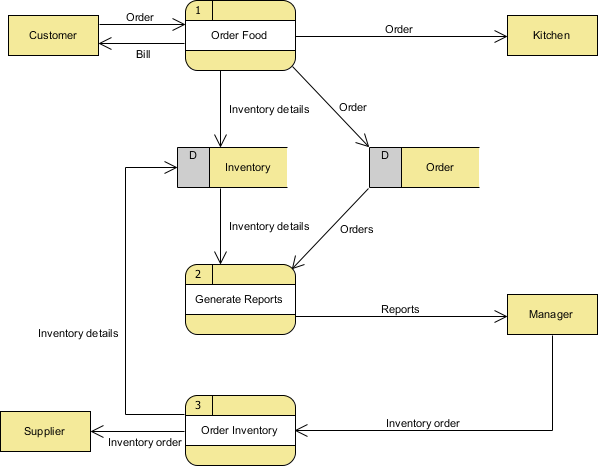
A data flow diagram (DFD) illustrates how data is processed by a system in terms of inputs and outputs. As its name indicates its focus is on the flow of information, where data comes from, where it goes and how it gets stored.
Advantages of DFD
It helps us to understand the functioning and the limits of a system.
It is a graphical representation which is very easy to understand as it helps visualize contents.
Data Flow Diagram represent detailed and well explained diagram of system components.
It is used as the part of system documentation file.
Data Flow Diagrams can be understood by both technical or nontechnical person because they are very easy to understand.
Disadvantages of DFD
At times DFD can confuse the programmers regarding the system.
Data Flow Diagram takes long time to be generated, and many times due to this reasons analysts are denied permission to work on it.
An Entity Relationship Diagram (ERD) is a graphical illustration of how “entities” relate to each other within a system.
ERDs for your project will need to show the relationships between your tables in your database.
Three types of an entity-relationship:
| Diagram | Name | Description |
|---|---|---|
 | One-to-One | A Country has only one Capital, and a Capital is in only one Country. |
 | One-to-Many | A Biological Mother can have many children, and a child can have only Biological Mother. |
 | Many-to-Many | An Author can write several Books, and a Book can be written by several Authors |
When linking between two tables, it is common for a field in the first table to link to the primary key of another table. In this case, the field in the first table will be called a foreign key.
Foreign key is a field in one table that is linked to the primary key in another table.
Scenario
The school holds competitions among Shanyrak/Teams. For each useful action, Shanirak points are scored. The deputy director keeps a record of all the items in the notebook. Counting and identifying all points takes a long time, and there may be errors. Automate the work.
Task:
Define entities for automated systems and types of relationships between entities.
